UII UPDATE 539 | OCTOBER 2026
Intelligence Update
Cutting AI carbon requires more than energy efficiency

One major criticism of generative AI is its carbon footprint, primarily driven by high energy consumption. A recent report explained that energy per token for inference is driven primarily by two factors: infrastructure utilization and throughput (see The problem with energy per token). Throughput reflects how efficiently a model generates tokens during active inference periods, while utilization reflects how efficiently the underlying hardware is utilized over its operational lifetime.
Converting energy per token into carbon means multiplying token energy by the carbon intensity of the electricity used at that point in time. However, it is rarely that simple in practice.
Uptime has previously stated that organizations aiming to reduce their carbon footprint materially should adopt a parallel approach: increase efficiency while choosing a lower-carbon electricity mix for their workloads (see The two sides of a sustainability strategy.)
This report shows that when it comes to AI, the same rules still apply.
Energy efficiency
To examine the carbon contributions of infrastructure efficiency and data center grid intensity, Uptime Intelligence modeled two operating scenarios using the same inference configuration as the previously referenced report.
The high-efficiency scenario assumes 70% utilization at 15,000 tokens per second, which is demanding but achievable for a well-managed, well-batched deployment using the modeled inference configuration. This yields 1.09 joules per token. The poor-efficiency scenario assumes 15% utilization at 2,000 tokens per second, representing an underused enterprise deployment with uneven demand and long idle periods. It results in 14.45 joules per token.
The energy-usage gap between the two modeled infrastructure cases is therefore about 13 times. If the grid intensity is the same for both implementations, the carbon emissions gap is also around 13 times. Infrastructure efficiency, therefore, has a substantial impact on carbon emissions. But variations in grid carbon intensity can obscure the benefit of better efficiency.
Carbon intensity
Grid carbon intensity is dynamic, not static. The emissions associated with electricity consumption depend not only on geography, but also on the generation resources available at a particular moment and the demands placed on the grid by other users.
Therefore, a data center consuming the same amount of electricity may have materially different emissions depending on the region where it operates and when it consumes that electricity. These variations can be substantial enough to obscure differences in infrastructure efficiency between locations. For this reason, energy efficiency and grid carbon intensity should be evaluated as separate variables, with carbon emissions viewed as the product of both factors rather than as a direct measure of infrastructure efficiency.
To demonstrate how different carbon intensities can overshadow the benefits of efficiency improvements, Figure 1 shows differences in average carbon intensity between selected regions.
Differences in countries' power mixes substantially affect their average grid carbon intensity. For example, in Norway, where hydropower dominates electricity generation, average carbon intensity is 28 gCO₂e/kWh. Contrast this with 670 gCO₂e/kWh in India, where coal remains a major part of the power mix. This represents roughly a 24-fold difference, almost double the modeled efficiency gap when intensity is constant.
Large differences exist both within countries and between them: in the US alone, West Virginia's grid carbon intensity is about 38 times that of Vermont's.
Figure 1 Carbon per million tokens in low and high efficiency cases for selected regions
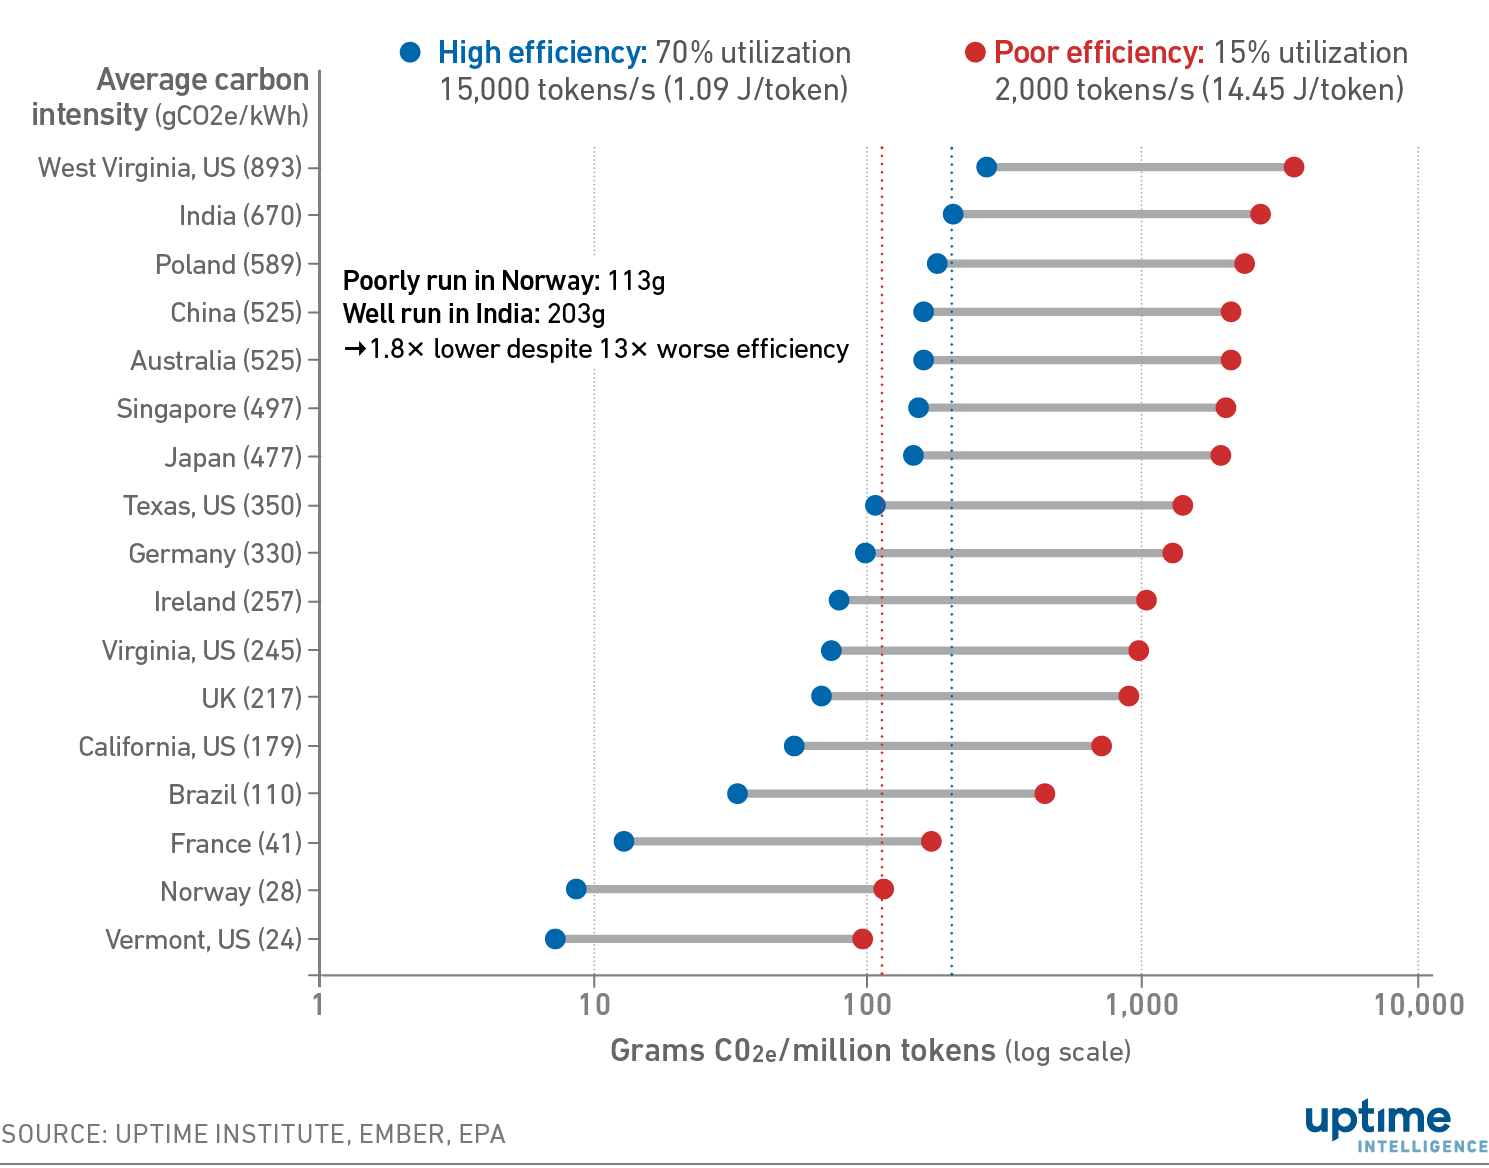
Figure 1 shows the consequence of these differences. Under the modeled assumptions, a poorly run deployment in Norway emits about 113 gCO₂e per million tokens. A well-run deployment in India emits about 203 gCO₂e per million tokens, almost twice as much, despite being about 13 times more energy efficient. Low-carbon grids keep their advantage even under poor operation: the same poorly run deployment in Norway also emits less than a highly efficient one in China or Australia, both about 159 gCO₂e per million tokens.
These results have practical implications for data center operators and their customers. Major data center hubs do not sit at the low-carbon end of the range. At high efficiency, inference in Virginia (US) results in about 74 gCO₂e per million tokens and in Ireland about 78 gCO₂e. These figures are six to nine times higher than in Norway (8.5 gCO₂e) or France (12.5 gCO₂e).
Efficiency is the lever
This analysis uses average carbon intensities. In practice, carbon emissions will vary substantially dependent on location and time period. But the data demonstrates that, when choosing between locations, workload placement can sometimes have a greater impact on carbon emissions than substantial improvements in infrastructure efficiency.
In practice, efficiency is the lever that operators control directly. Most operators cannot move existing capacity. Sovereignty, existing assets, capacity and proximity to users often prevent operators from using data centers with a lower carbon footprint.
Carbon intensity often varies from hour to hour and is never fully under the operator's control. Operators do, however, manage infrastructure efficiency and use. Infrastructure operators should therefore maximize the efficiency of the infrastructure they control. At the same time, customers with flexibility over workload placement should also consider the carbon intensity of the electricity supplying different locations.
Methodology and limitations
These comparisons use location-based annual average grid intensity. Actual emissions can vary by hour, season, contract structure and workload scheduling, so operators with flexible inference workloads may achieve further reductions by shifting demand to lower-carbon periods, as well as lower-carbon locations.
Carbon per token is energy per token, measured at the facility level including PUE, multiplied by location-based annual average grid carbon intensity. Grid data comes from two sources:
- US states. EPA eGRID2023, recent official data available at the time of writing (October 2026).
- Other countries. Ember, via Our World in Data, using the latest year not flagged as an estimate.
Sources differ in how they calculate and report grid carbon intensity. These differences can affect precise comparisons, but they are unlikely to change this report's conclusions.
The Uptime Intelligence View
The public is understandably concerned about AI's carbon footprint. Improving energy efficiency is the first step in reducing emissions by optimizing power and infrastructure use to reduce energy per token. But carbon intensity varies by time of day and geography. Those not constrained by sovereignty, latency, cost, resilience and existing infrastructure can reduce emissions by moving workloads to facilities with lower carbon-intensity. In practice, organizations likely need to improve operational efficiency and reduce the carbon intensity of consumed energy to make meaningful reductions.
About the Author

Dr. Owen Rogers
Dr. Owen Rogers is Uptime Institute’s Senior Research Director of Cloud Computing. Dr. Rogers has been analyzing the economics of cloud for over a decade as a chartered engineer, product manager and industry analyst. Rogers covers all areas of cloud, including AI, FinOps, sustainability, hybrid infrastructure and quantum computing.
orogers@uptimeinstitute.com