Intelligence Update
When high availability hurts sustainability

In recent years, the environmental sustainability of IT has become a significant concern for investors and customers, as well as regulatory, legislative and environmental stakeholders. This concern is expected to intensify as the impact of climate change on health, safety and the global economy becomes more pronounced. It has given rise to an assortment of voluntary and mandatory initiatives, standards and requirements that collectively represent, but do not yet define, a basic framework for sustainable IT.
Cloud providers have come under increasing pressure from both the public and governments to reduce their carbon emissions. Their significant data center footprints consume considerable energy to deliver an ever-increasing range of cloud services to a growing customer base. The recent surge in generative AI has thrust the issues of power and carbon further into the spotlight.
Cloud providers have responded with large investments in renewable energy and energy attribute certificates (EACs), widespread use of carbon offsets and the construction of high-efficiency data centers. However, the effectiveness of these initiatives and their impact on carbon emissions vary significantly depending on the cloud provider. While all are promoting an eco-friendly narrative, unwrapping their stories and marketing campaigns to find meaningful facts and figures is challenging.
These efforts and initiatives have garnered considerable publicity. However, the impact of customer configurations on carbon emissions can be considerable and often overlooked. To build resiliency into cloud services, users face a range of options, each carrying its own carbon footprint.
In previous reports, Uptime Intelligence modeled several resilient architectures and determined their availability and cost. This report expands on that research by examining how resiliency affects carbon emissions.
Sustainability is the customer’s responsibility
The reduction of hyperscaler data center carbon emissions is being fought on two fronts. First, service providers are transitioning to lower-carbon energy sources. Second, cloud customers are being encouraged to optimize their resource usage through data and reporting to help lower carbon emissions.
Cloud provider responsibilities
Data centers consume significant power. To reduce their carbon impact, many cloud providers are investing in carbon offsets — these are projects with a negative carbon impact that can balance or negate carbon emissions by a specified weight.
Renewable energy certificates (RECs) are tradable, non-tangible energy commodities. Each REC certifies that the holder has used or will use a quantity of electricity generated from a renewable source, thus avoiding the need for carbon emission offsets for that power use.
Cloud providers can use both offsets and RECs to claim their overall carbon emissions are zero. However, this does not equate to zero carbon production; instead it means providers are balancing their emissions by accounting for a share of another organization’s carbon reductions.
Although cloud providers are making their own environmental changes, responsibility for sustainability is also being shared with users. Many providers now offer access to carbon emissions information via online portals and application programming interfaces (APIs), aiming to appear “green” by supporting users to measure, report and reduce carbon emissions.
Customer responsibilities
In public cloud, application performance and resiliency are primarily the responsibility of the user. While cloud providers offer services to their customers, they are not responsible for the efficiency or performance of the applications that customers build.
The cloud model lets customers consume services when they are needed. However, this flexibility and freedom can lead to overconsumption, increasing both costs and carbon emissions.
Tools and guidelines are available to help customers manage their cloud usage. Typical recommendations include resizing virtual machines to achieve higher utilization or turning off unused resources. However, these are only suggestions; it is the job of their customers to implement any changes.
Since cloud providers charge based on the resources used, helping customers to reduce their cloud usage is likely to also reduce their bills, which in the short term may impact provider revenue. However, cloud providers are willing to take this risk, betting that helping customers lower both carbon emissions and costs will increase overall revenue in the longer term.
Cloud customers are also encouraged to move workloads to regions with less carbon-heavy electricity supplies. This can often result in lower costs for their customers and lower carbon emissions — a win-win. However, it is up to the customer to implement these changes.
Cloud users face a challenging balancing act: they need to architect applications that are available, cost-effective and have a low carbon footprint. Even with the aid of tools, achieving this balance is far from easy.
Previous research
In previous reports to compare cost, carbon emissions and availability between architectures, Uptime Intelligence started by defining an unprotected baseline. This is an application situated in a single location and not protected from a loss of availability zone (a data center) or region (a collection of closely connected data centers). Then, other architectures were designed to distribute resources across availability zones and regions so that the application could operate during outages. The costs of these new architectures were compared with the price of the baseline to assess how increased availability affects cost.
Table 1 provides an overview of these architectures. A full description can be found in Build resilient apps: do not rely solely on cloud infrastructure.
Table 1 Summary of application architecture characteristics
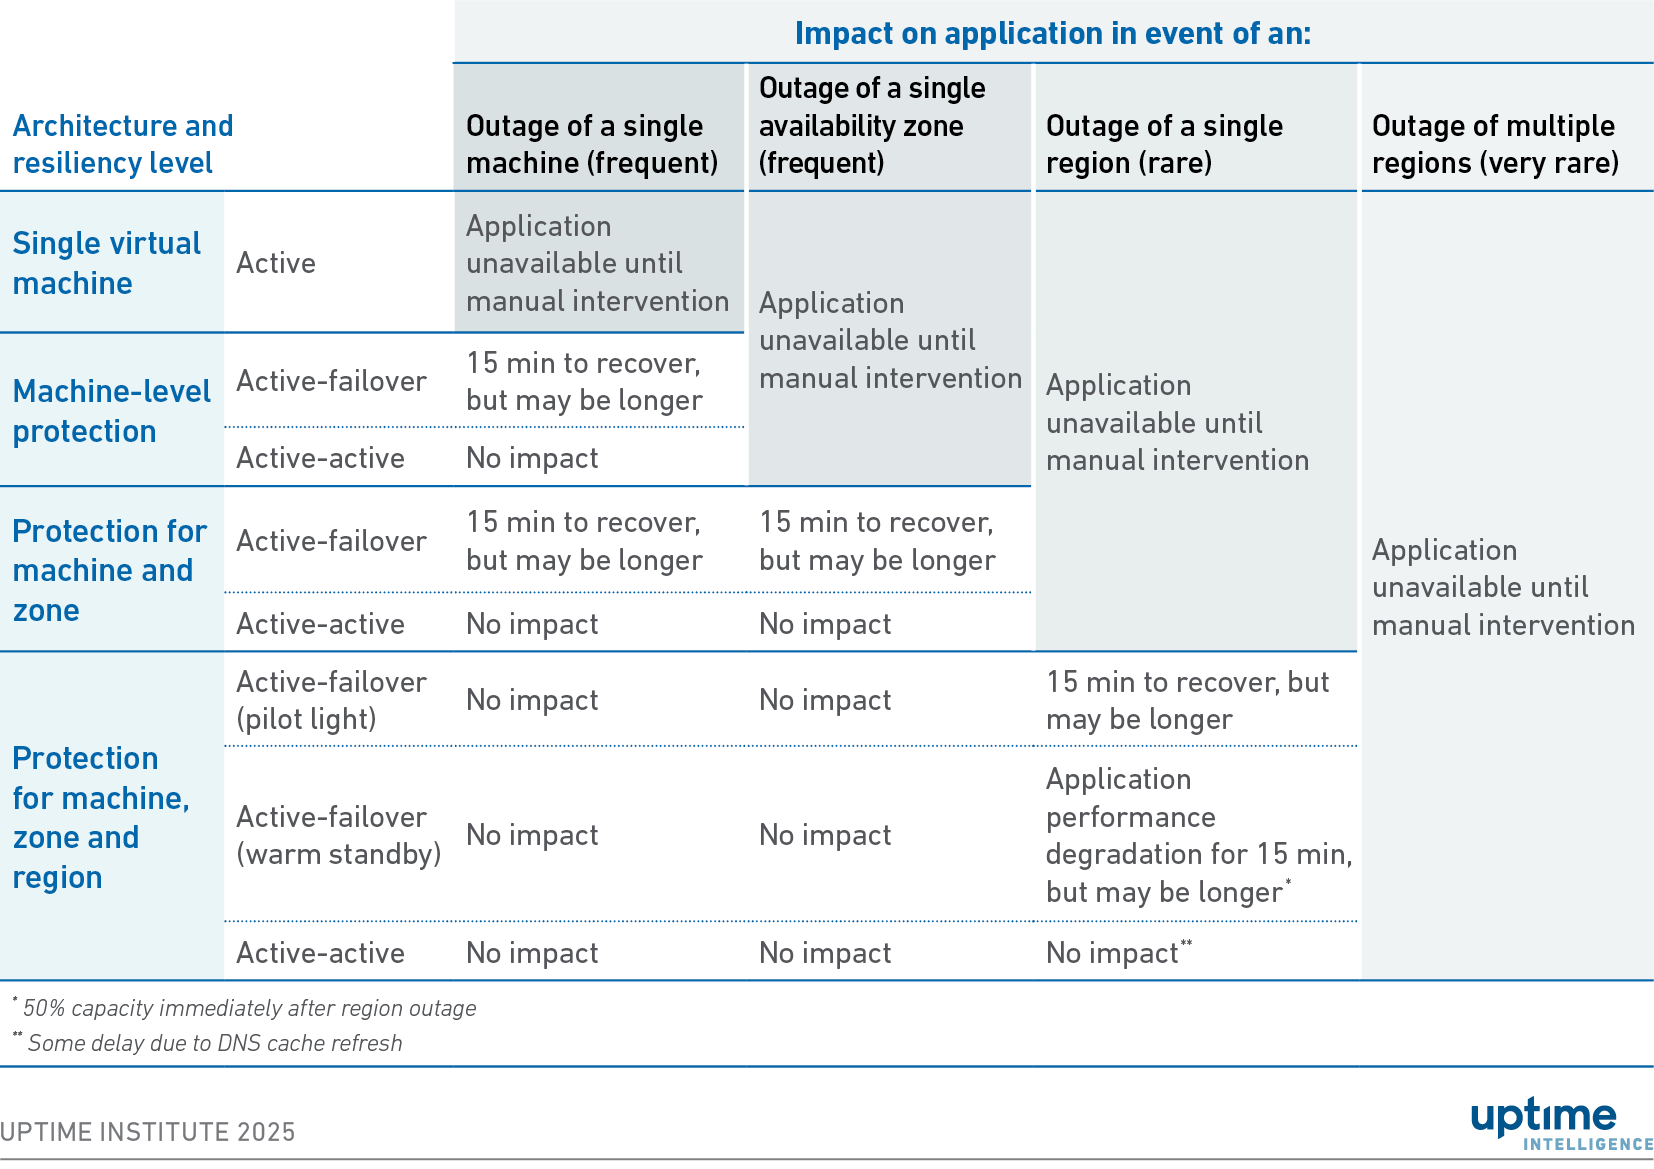
An availability percentage for 2024 was calculated using historical status update information for each architecture. A description of that process can be found in Outage data shows cloud apps must be designed for failure.
In the cloud, applications are charged based on the resources consumed to deliver that application. An application architected across multiple locations uses more resources than one deployed in a single location. In Cloud availability comes at a price the cost of using each application was calculated.
Finally, in this report, Uptime Intelligence calculates the carbon emissions for each architecture and combines this with the availability and cost data.
Carbon versus cost versus downtime
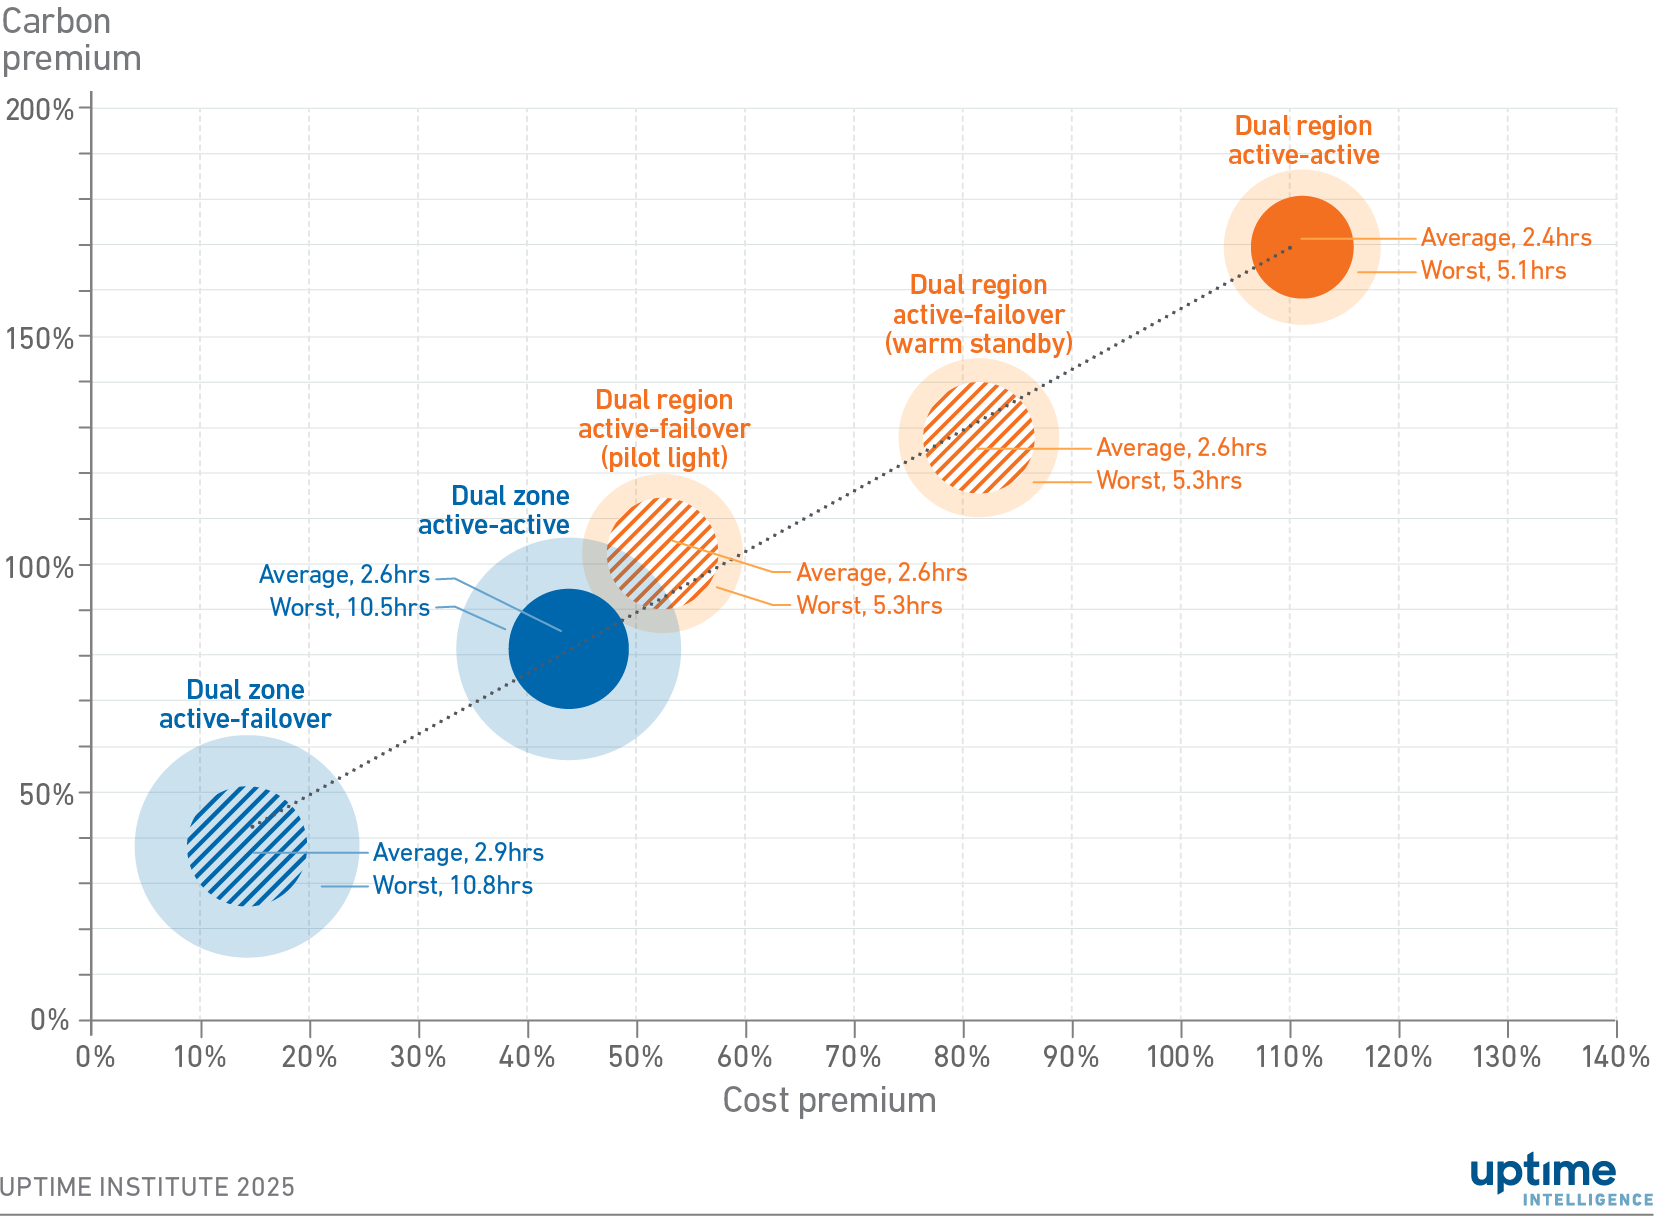
Figure 1 combines availability, cost and carbon emissions into a single chart. The carbon quantities are based on the location-based Scope 2 emissions, which are associated with the electricity consumed by the data center. The availability of the architectures is represented by bubble sizes: inner rings indicate the average annual downtime across all regions in 2024, while the outer rings show the worst-case regional downtime. The axes display cost and carbon premiums, which reflect additional costs and carbon emissions relative to the unprotected baseline. The methodology for calculating carbon is included as an appendix at the end of this report.
Figure 1 Average and worst-case regional availabilities by carbon and cost
Findings
Figure 1 shows that the cost premium is linearly proportional to carbon emissions — a rise in cost directly corresponds to an increase in carbon emissions, and vice versa. This proportionality makes sense: designing for resiliency uses more resources across multiple regions. Due to the cloud's consumption-based pricing model, more resources equate to higher costs. And with more resources, more servers are working, which produces more carbon emissions.
However, higher costs and carbon emissions do not necessarily translate into better availability. As shown in Figure 1, the size of the bubbles does not always decrease with an increase in cost and carbon. Customers, therefore, do not have to pay the highest premiums in cash and carbon terms to obtain good availability. However, they should expect that resilient applications will require additional expenditure and produce more carbon emissions.
A good compromise is to architect the application across regions using a pilot light configuration. This design provides an average annual downtime of 2.6 hours, a similar level of availability to the equivalent dual region active-active configuration, but with roughly half the cost and carbon emissions.
Even if this architecture were deployed across the worst-performing regions, downtime would remain relatively low at 5.3 hours, which is still consistent with the more expensive resilient design.
However, although the cost and carbon premiums of the pilot light design are at the midpoint in our analysis, they are still high. Compared with an unprotected application, a dual region pilot light configuration produces double the carbon emissions and costs 50% more.
For those organizations looking to keep emissions and costs low, a dual zone active-failover provides an average downtime of 2.9 hours per year at a cost premium of 14% and a carbon premium of 38%. However, it is more susceptible to regional failures — in the worst-performing regions, downtime increases almost fourfold to 10.8 hours per year.
Conclusions
In all examined cases, increases in carbon are substantial. High availability inevitably comes with an increase in carbon emissions. Enterprises need to decide what compromises they are willing to make between low cost, low carbon and high availability.
These trade-offs should be evaluated during the design phase, before implementation. Ironically, most tools provided by cloud providers only focus on reporting and optimizing current resource usage rather helping assess the impact of potential architectures.
AWS provides its Customer Carbon Footprint Tool, Google offers a Cloud Carbon Footprint capability, Microsoft delivers an Emissions Impact Dashboard for Azure, IBM has a Cloud Carbon Calculator, and Oracle Cloud has its OCI Sustainability Dashboard. These tools aid carbon reporting and may make recommendations to reduce carbon emissions. However, they do not suggest fundamental changes to the architecture design based on broader requirements such as cost and availability.
Considering the direct relationship between carbon emissions and cost, organizations can take some comfort in knowing that architectures built with an awareness of cost optimization are also likely to reduce emissions. In AWS’s Well-Architected framework for application development, the Cost Optimization pillar and the Sustainability pillar share similarities, such as turning off unused resources and sizing virtual machines correctly. Organizations should investigate if their cost optimization developments can also reduce carbon emissions.
The Uptime Intelligence View
The public cloud may initially appear to be a low-cost, low-carbon option. However, customers aiming for high availability should architect their applications across availability zones and regions. More resources running in more locations equates to higher costs (due to the cloud's consumption-based pricing) and increased carbon emissions (due to the use of multiple physical resources). Ultimately, those developing cloud applications need to decide where their priorities lie regarding cost reduction, environmental credentials and user experience.
Appendix: methodology
The results presented in this report should not be considered prescriptive but hypothetical use cases. Readers should perform their own analyses before pursuing or avoiding any action.
Data is obtained from the Cloud Carbon Footprint (CCF) project, an open-source tool for analyzing carbon emissions. This initiative seeks to aid users in measuring and reducing the carbon emissions associated with their public cloud use.
The CCF project uses several sources, including the SPECpower database, to calculate power consumption for various cloud services hosted on AWS, Google and Microsoft Azure. SPECpower is a database of power consumption at various utilization points for various servers. Power is converted to an estimate of carbon emissions using data from the European Environment Agency, the US Environmental Protection Agency and carbonfootprint.com.
Uptime Intelligence used the CCF’s carbon and power assumptions to estimate carbon emissions for several cloud architectures. We consider the CCF’s methodology and assumptions reasonable enough to compare carbon emissions based on cloud architecture. However, we cannot state that the CCF’s tools, methods and assumptions suit all purposes. That said, the project’s open-source and collaborative nature means it is more likely to be an unbiased and fair methodology than those offered by cloud providers.
The CCF’s methodology details are available on the project’s website and in the freely accessible source code. See cloudcarbonfootprint.org/docs/methodology.
For this research, Uptime Intelligence has based our calculations on Amazon Web Services (AWS). Not only is AWS the market leader, but it also provides sufficiently detailed information to make an investigation possible. Other public cloud services have similar pricing models, services and architectural principles — this report's fundamental analysis will apply to other cloud providers. AWS costs are obtained from the company's website and carbon emissions are obtained from the CCF project's assumptions for AWS. We used an m5.large virtual machine in us-east-1 for our architecture.
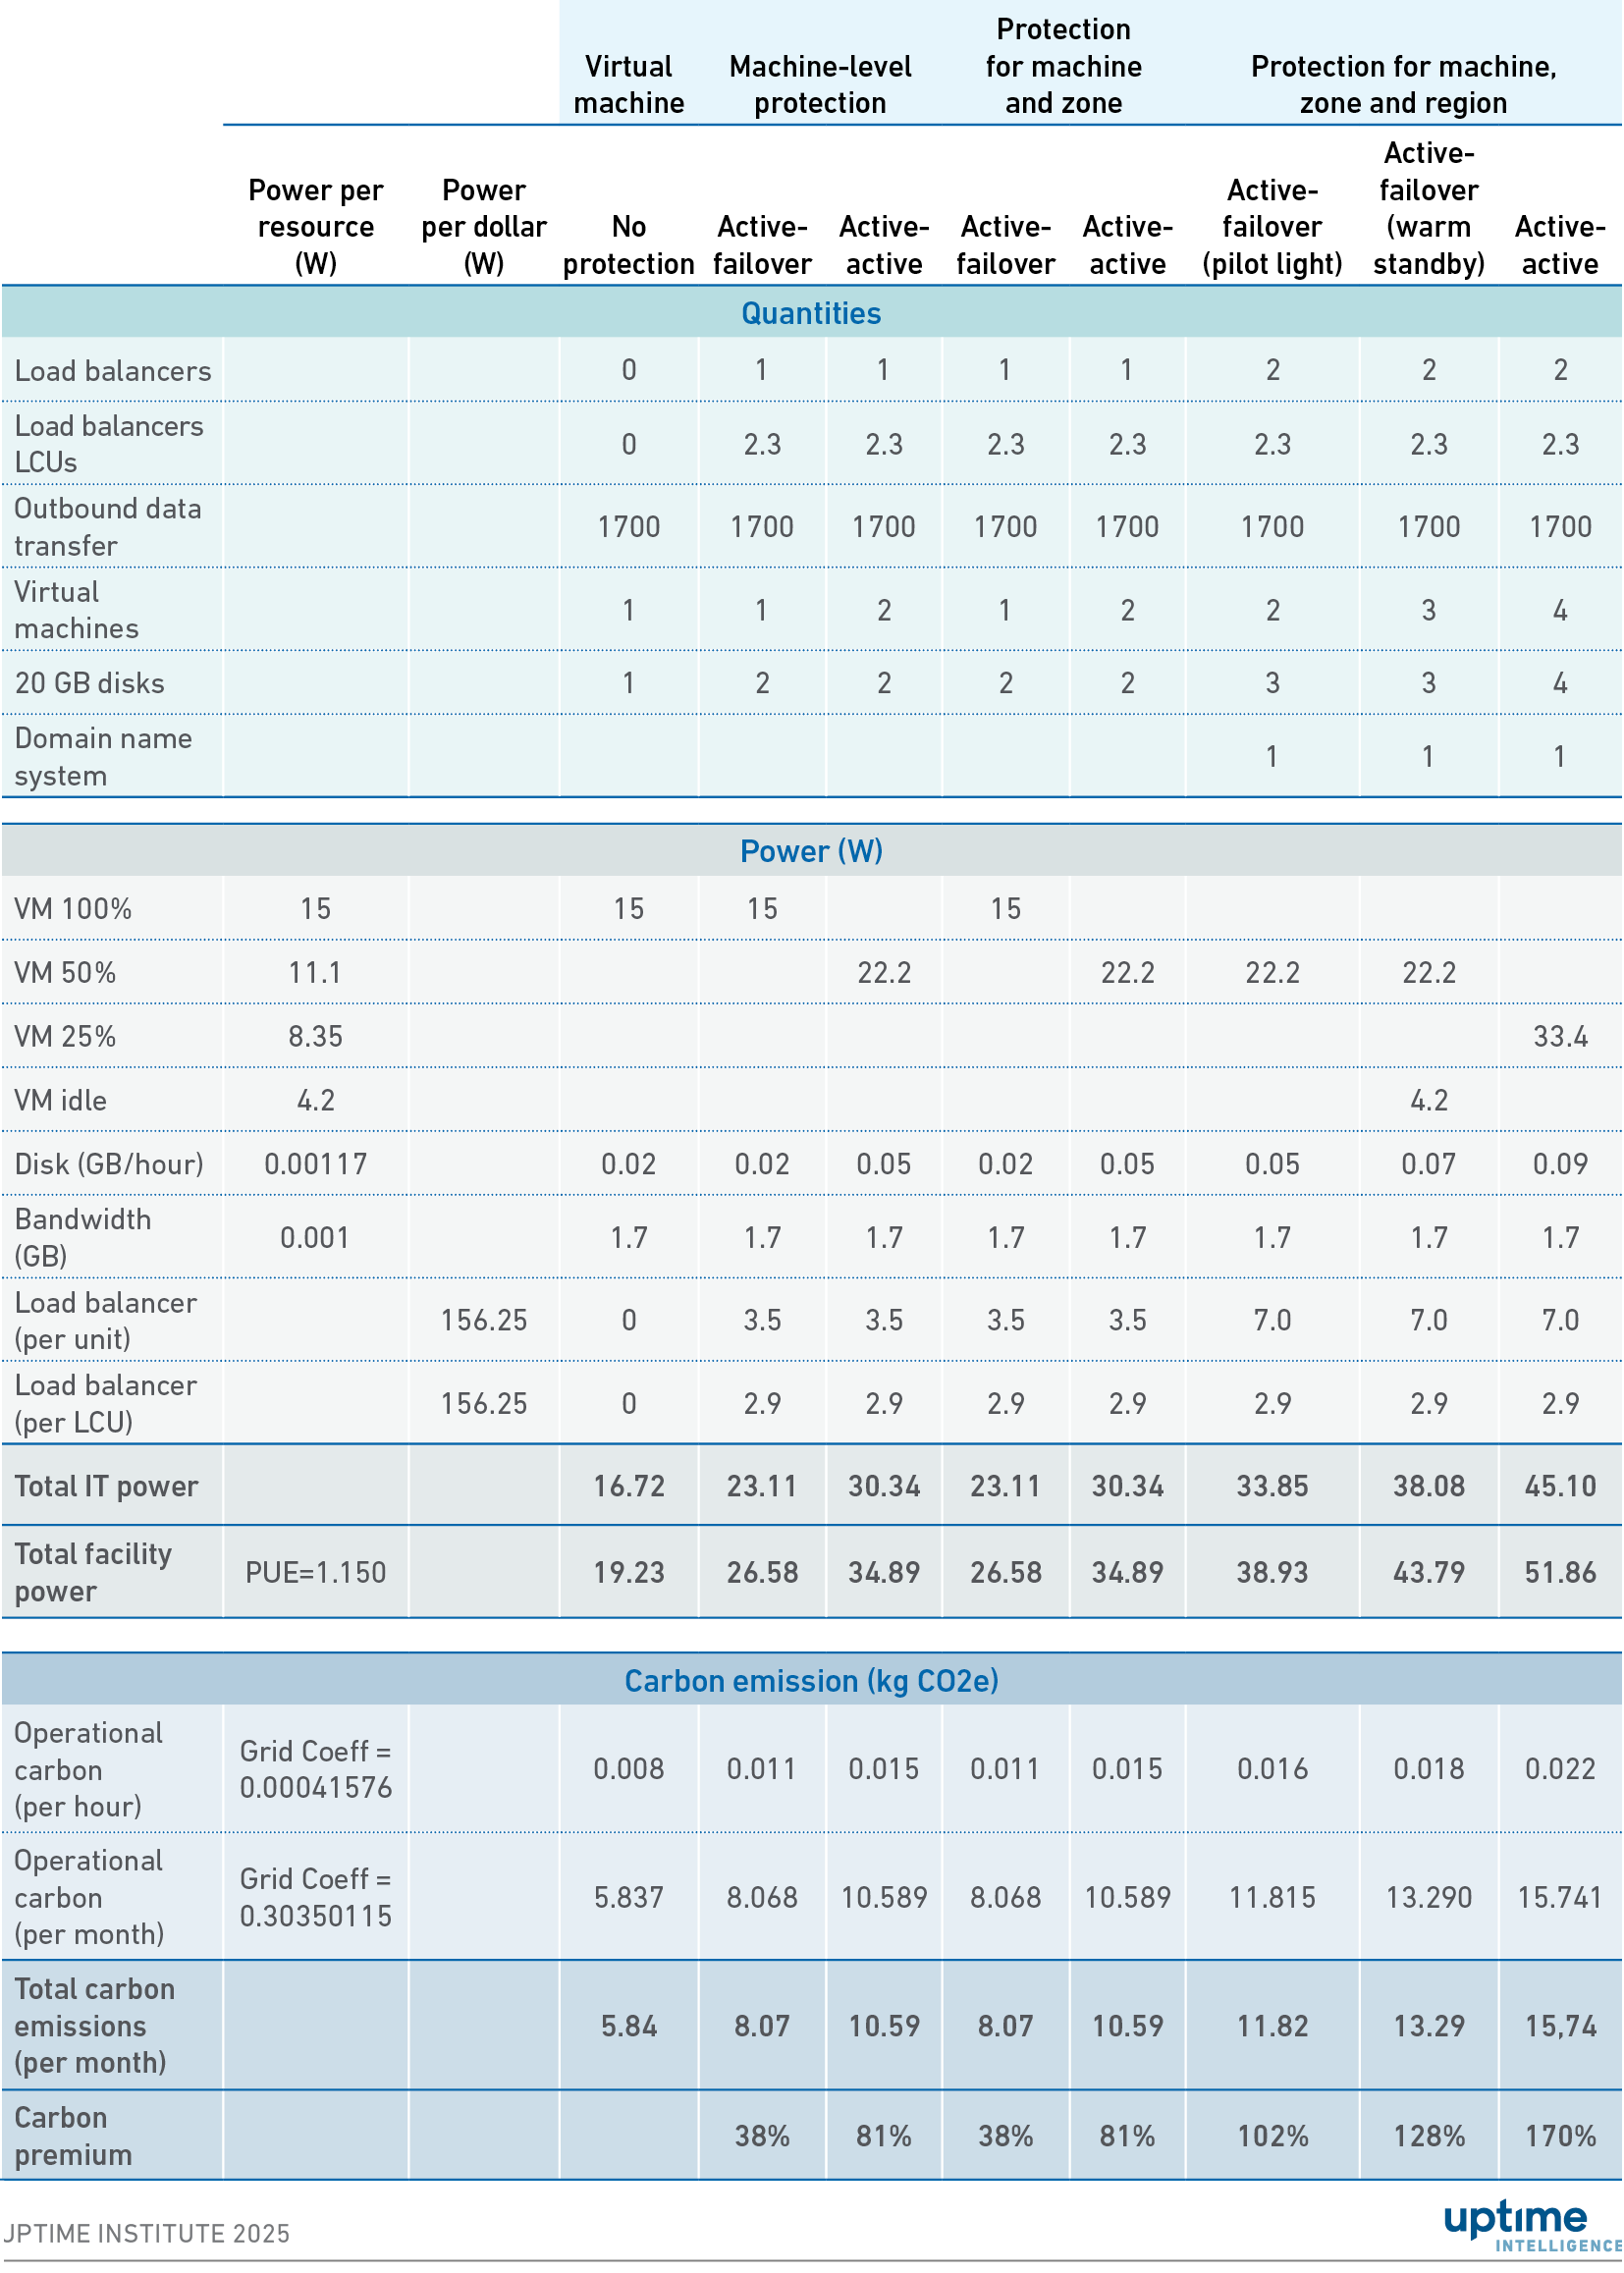
Table 2 shows the carbon emissions calculations based on these sources.
Table 2 Carbon emissions calculations
The following Uptime Institute expert was consulted for this report:
Jay Dietrich, Research Director of Sustainability, Uptime Institute
About the Author

Owen Rogers
Dr. Owen Rogers is Uptime Institute’s Senior Research Director of Cloud Computing. Dr. Rogers has been analyzing the economics of cloud for over a decade as a chartered engineer, product manager and industry analyst. Rogers covers all areas of cloud, including AI, FinOps, sustainability, hybrid infrastructure and quantum computing.
orogers@uptimeinstitute.com